
【pythonの基礎#3】データの可視化(matplotlib)
記事の目的
pythonの基礎である、データを可視化する際に使用するmatplotlibについて実装していきます。ここにある全てのコードは、コピペで再現することが可能です。
目次
1 ライブラリ
import numpy as np
import matplotlib.pyplot as plt
2 データの可視化
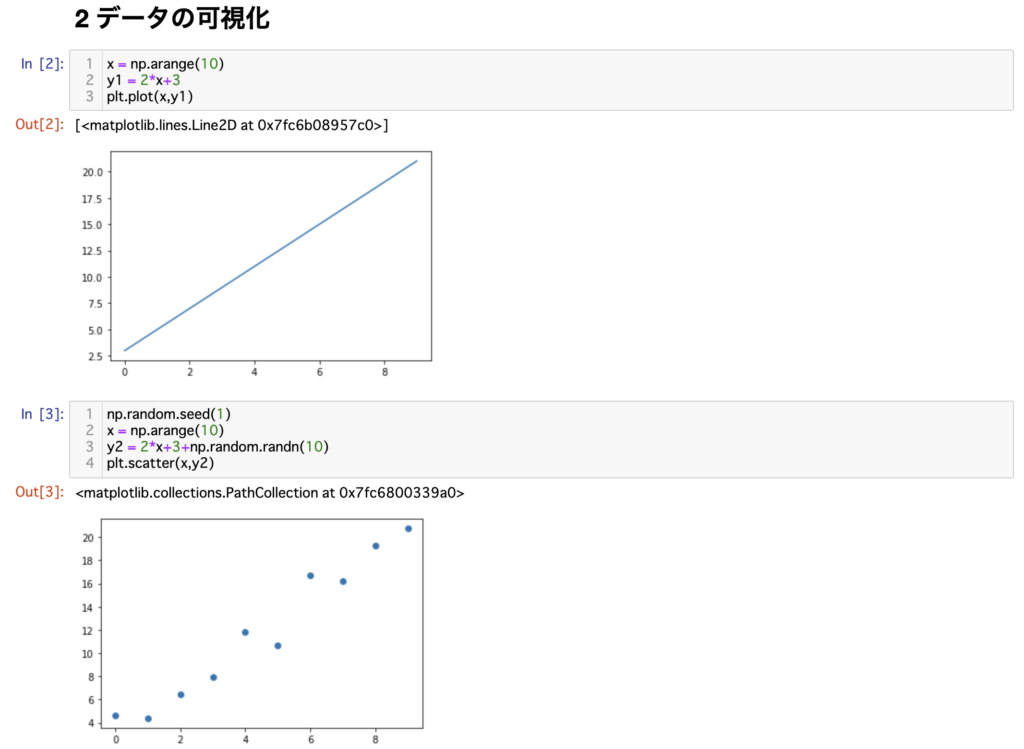
# In[2]
x = np.arange(10)
y1 = 2*x+3
plt.plot(x,y1)

# In[3]
np.random.seed(1)
x = np.arange(10)
y2 = 2*x+3+np.random.randn(10)
plt.scatter(x,y2)
3 いろいろな可視化
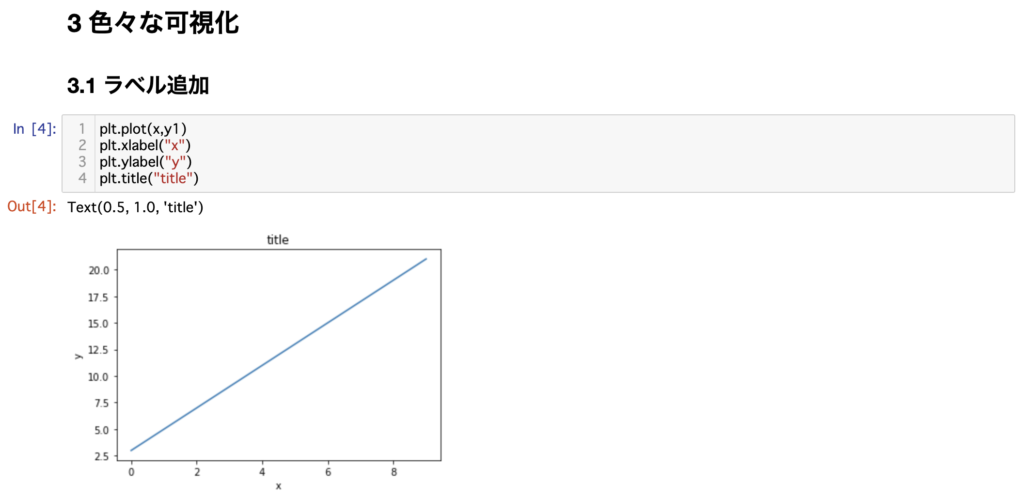
# In[4]
plt.plot(x,y1)
plt.xlabel("x")
plt.ylabel("y")
plt.title("title")
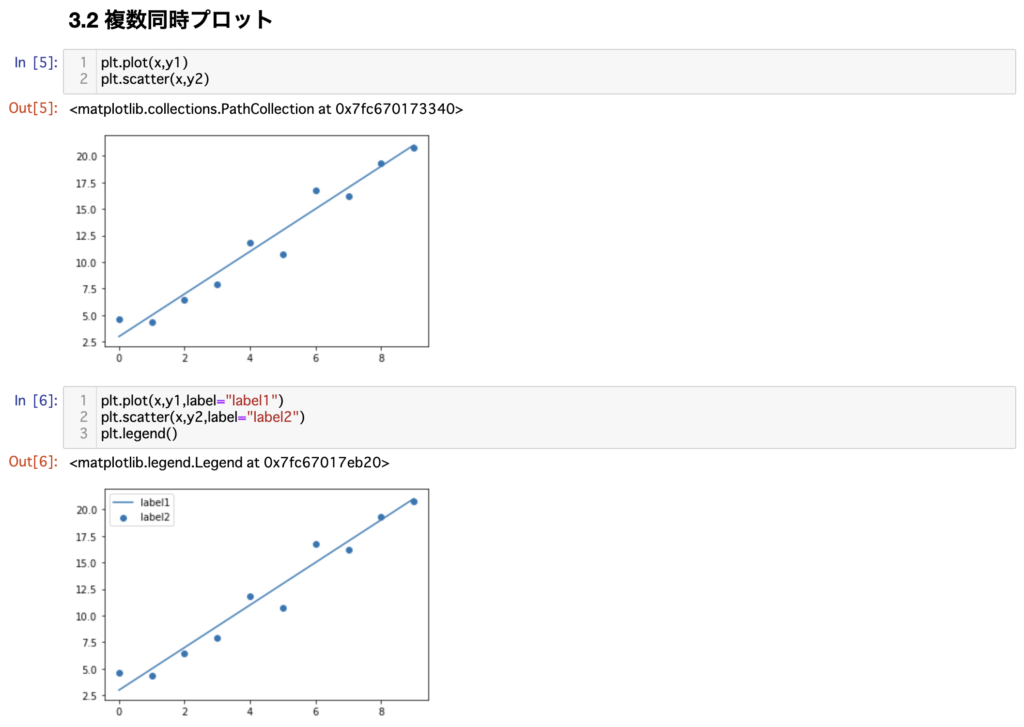
# In[5]
plt.plot(x,y1)
plt.scatter(x,y2)
# In[6]
plt.plot(x,y1,label="label1")
plt.scatter(x,y2,label="label2")
plt.legend()
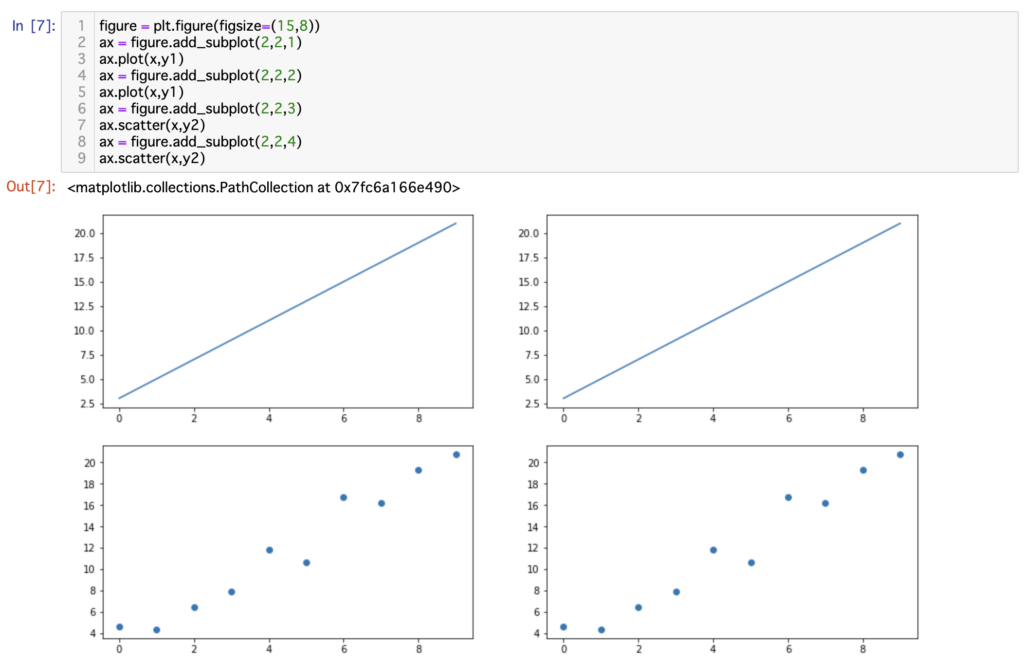
# In[7]
figure = plt.figure(figsize=(15,8))
ax = figure.add_subplot(2,2,1)
ax.plot(x,y1)
ax = figure.add_subplot(2,2,2)
ax.plot(x,y1)
ax = figure.add_subplot(2,2,3)
ax.scatter(x,y2)
ax = figure.add_subplot(2,2,4)
ax.scatter(x,y2)


