
【Rで統計学#8】分散分析
記事の目的
R言語を使用して、分散分析について実装していきます。
目次
1 使用するライブラリ
install.packages("dplyr") # 一度もインストールしていない場合
install.packages("ggplot2") # 一度もインストールしていない場合
install.packages("tidyr") # 一度もインストールしていない場合
install.packages("stringr") # 一度もインストールしていない場合
install.packages("gridExtra") # 一度もインストールしていない場合
library(dplyr)
library(ggplot2)
library(tidyr) # gather()
library(stringr) # str_detect()
library(gridExtra) # grid.arrange()
2 一元配置分散分析
2.1 データの作成
set.seed(10)
講義A <- rnorm(10, 600, 100) %>% round()
講義B <- rnorm(10, 650, 100) %>% round()
講義C <- rnorm(10, 700, 100) %>% round()
dataA <- data.frame(講義A, 講義B, 講義C)
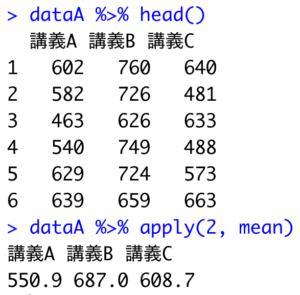
dataA %>% head()
dataA %>% apply(2, mean)
2.2 データの変形
dataA_all <- dataA %>%
  gather(key=講義, value = 点数, 講義A, 講義B, 講義C)
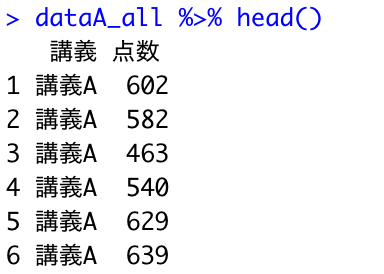
dataA_all %>% head()
dataA %>% apply(2, mean)
2.3 データの可視化
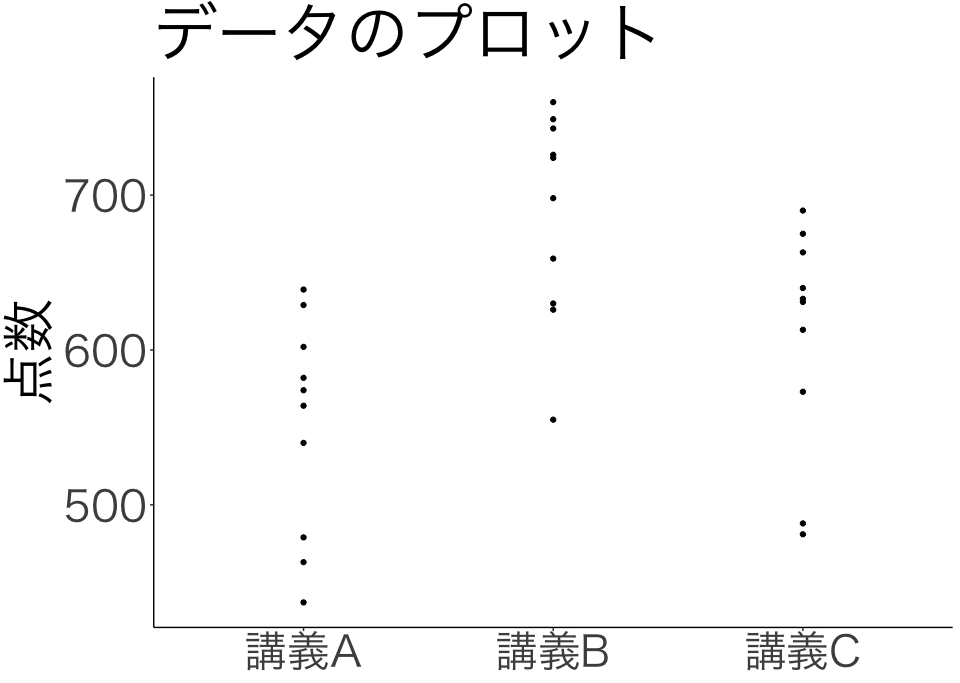
dataA_all %>%
  ggplot() +
  geom_point(aes(講義, 点数)) +
  theme_classic(base_family = "HiraKakuPro-W3") +
  theme(text=element_text(size=40)) +
  labs(x=NULL, title="データのプロット")
2.4 分散分析実装
anova(lm(data=dataA_all, 点数~講義))

3 二元配置分散分析
3.1 データの作成
set.seed(10)
講師1講義A <- rnorm(10, 600, 100) %>% round()
講師1講義B <- rnorm(10, 650, 100) %>% round()
講師1講義C <- rnorm(10, 700, 100) %>% round()
講師2講義A <- rnorm(10, 600, 100) %>% round()
講師2講義B <- rnorm(10, 600, 100) %>% round()
講師2講義C <- rnorm(10, 600, 100) %>% round()
dataB <- data.frame(講師1講義A, 講師1講義B, 講師1講義C, 講師2講義A, 講師2講義B, 講師2講義C)
dataB %>% head()

3.2 データの変形
dataB_new <- dataB %>%
  gather(key=講義, value = 点数, 講師1講義A, 講師1講義B, 講師1講義C, 講師2講義A, 講師2講義B, 講師2講義C)
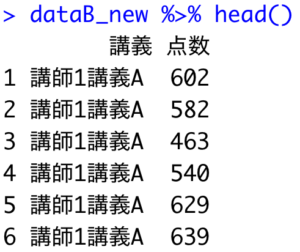
dataB_new %>% head()
data_new <- dataB %>%
  gather(key=講義, value = 点数, 講師1講義A, 講師1講義B, 講師1講義C, 講師2講義A, 講師2講義B, 講師2講義C) %>%
  mutate(講師=ifelse(str_detect(講義, "講師1"), "講師1", "講師2")) %>%
  mutate(講義=ifelse(str_detect(講義, "講義A"), "講義A", ifelse(str_detect(講義,"講義B"), "講義B", "講義C")))
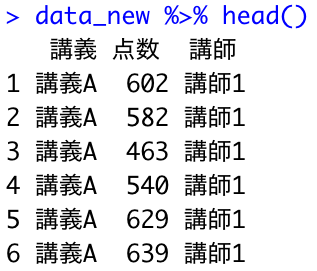
data_new %>% head()
3.3 データの平均
mu1 <- data_new %>%
  group_by(講義) %>%
  summarise(mu = mean(点数))
mu2 <- data_new %>%
  group_by(講師) %>%
  summarise(mu = mean(点数))
mu <- dataB %>%
  apply(2, mean) %>% as.data.frame()
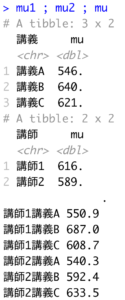
mu1 ; mu2 ; mu
3.4 データの可視化
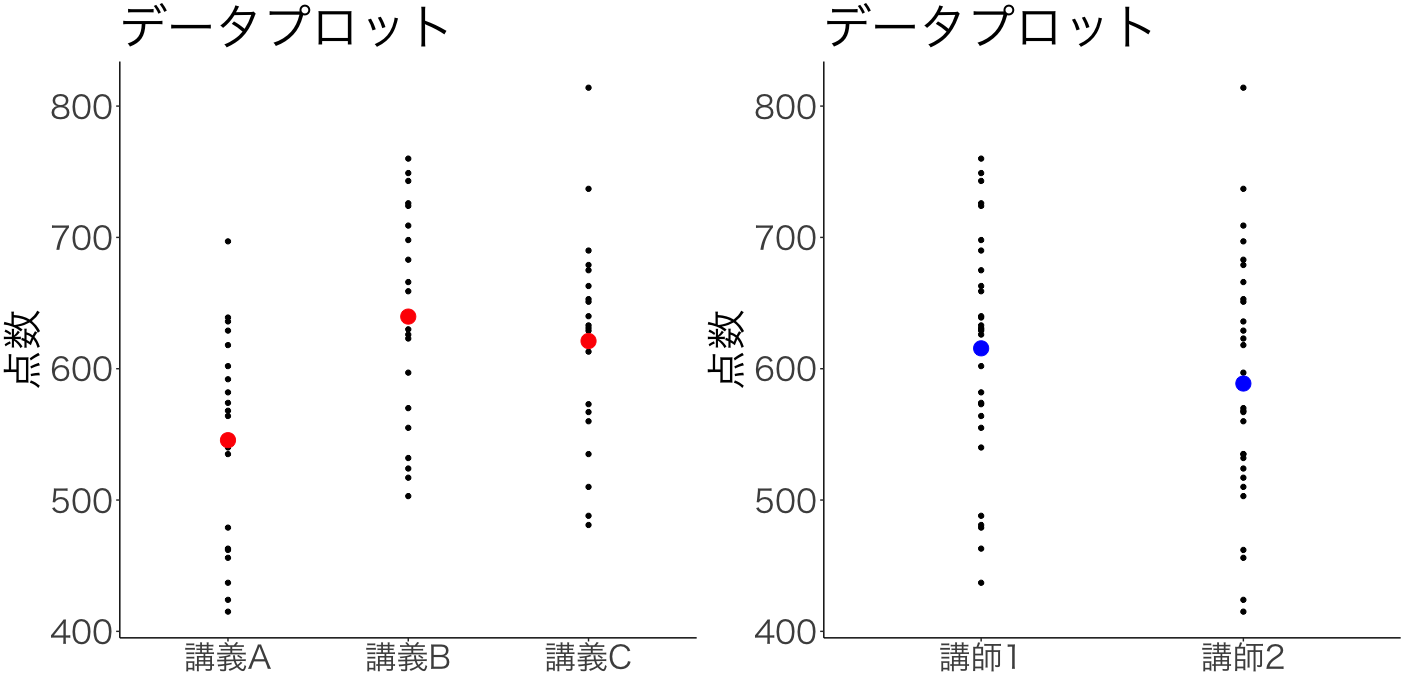
p1 <- ggplot() +
  geom_point(aes(data_new$講義, data_new$点数)) +
  theme_classic(base_family = "HiraKakuPro-W3") +
  theme(text=element_text(size=30)) +
  geom_point(aes(mu1$講義, mu1$mu), size=5, col="red") +
  labs(title="データプロット", x=NULL, y="点数")
p2 <- ggplot() +
  geom_point(aes(data_new$講師, data_new$点数)) +
  theme_classic(base_family = "HiraKakuPro-W3") +
  theme(text=element_text(size=30)) +
  geom_point(aes(mu2$講師, mu2$mu), size=5, col="blue") +
  labs(title="データプロット", x=NULL, y="点数")
grid.arrange(p1, p2, nrow=1)
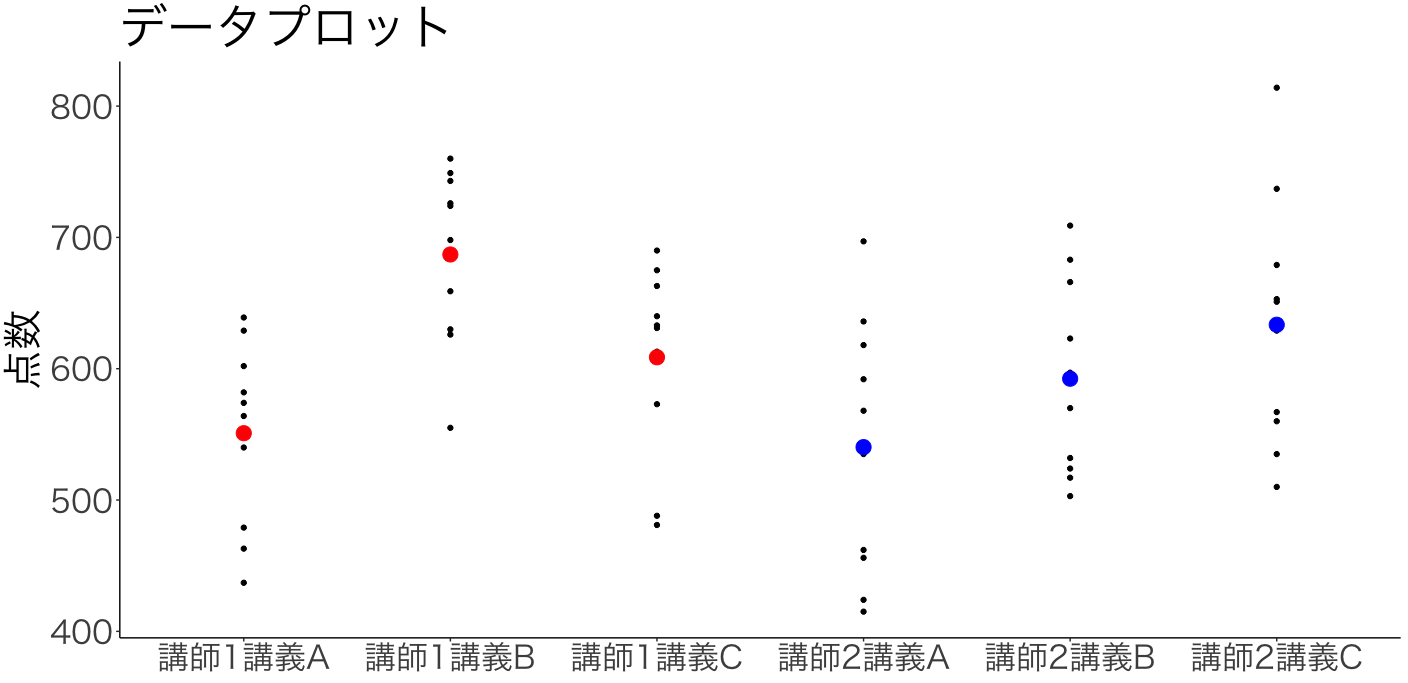
ggplot() +
  geom_point(aes(dataB_new$講義, dataB_new$点数)) +
  theme_classic(base_family = "HiraKakuPro-W3") +
  theme(text=element_text(size=30)) +
  geom_point(aes(rownames(mu)[1:3], mu$.[1:3]), size=5, col="red") +
  geom_point(aes(rownames(mu)[4:6], mu$.[4:6]), size=5, col="blue")+
  labs(title="データプロット", x=NULL, y="点数")
3.5 二元配置分散分析実装
summary(aov(data=data_new, 点数~講義+講師))

summary(aov(data=data_new, 点数~講義*講師))


