【Rで統計学#3】確率分布
記事の目的
R言語を使用して、確率分布について実装していきます。
目次
1 使用するライブラリ
install.packages("dplyr")
install.packages("ggplot2")
install.packages("gridExtra")
library(dplyr)
library(ggplot2)
library(gridExtra)
2 確率分布からの乱数発生 r分布名(サンプルサイズ, パラメータ)
set.seed(10)
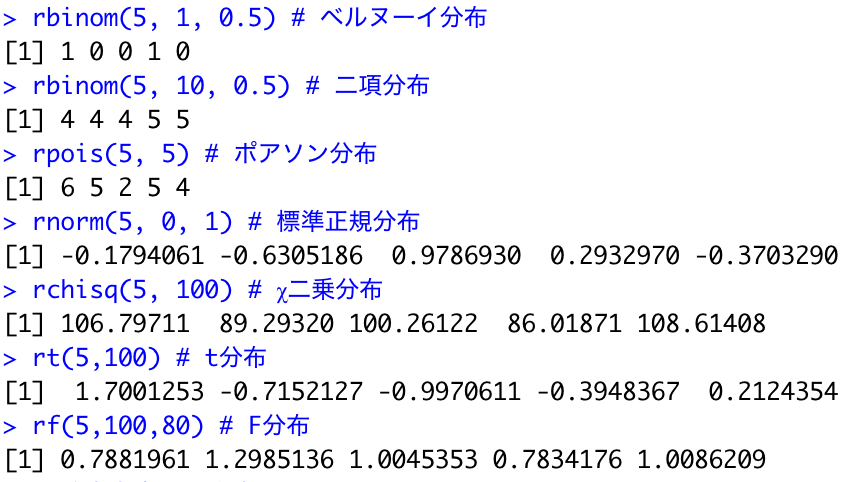
rbinom(5, 1, 0.5) # ベルヌーイ分布
rbinom(5, 10, 0.5) # 二項分布
rpois(5, 5) # ポアソン分布
rnorm(5, 0, 1) # 標準正規分布
rchisq(5, 100) # χ二乗分布
rt(5,100) # t分布
rf(5,100,80) # F分布

3 確率密度 d分布名(サンプルサイズ, パラメータ)
3.1 確率密度
d1 <- dnorm(1, 0, 1) # N(0,1)のx=1の確率密度

3.2 確率密度の可視化
x <- seq(-3, 3, 0.1)
y <- dnorm(x, 0, 1)
ggplot() +
  geom_line(aes(x,y)) +
  theme_classic(base_family="HiraKakuPro-W3")+ # テーマと文字化け修正
  theme(text=element_text(size=30)) + # 文字サイズ
  labs(title="標準正規分布") + # タイトル
  geom_point(aes(1,d1), size=5) + # d1の点
  annotate("text",x=1.5,y=d1+0.02, label="(1,d1)", size=10) # d1という文字

4 確率点 q分布名(p, パラメータ)
4.1 確率点
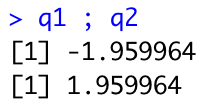
q1 <- qnorm(0.025, 0, 1)
q2 <- qnorm(0.975, 0, 1)
q1 ; q2

4.2 確率点のプロット
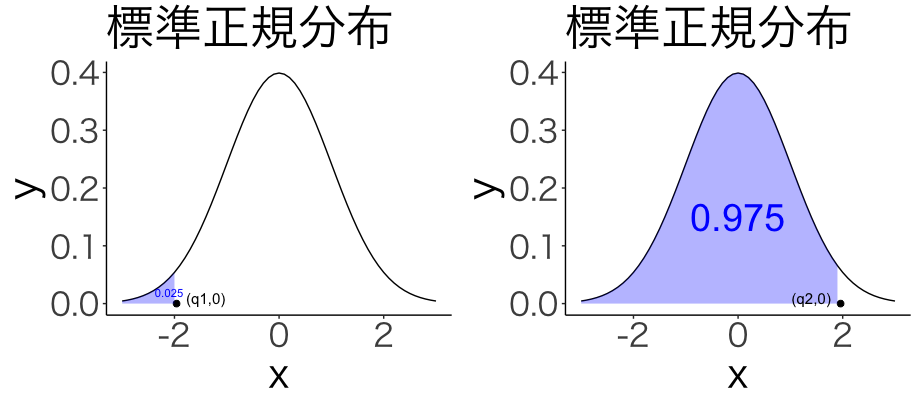
p1 <- ggplot() +
  geom_line(aes(x,y)) +
  theme_classic(base_family="HiraKakuPro-W3")+ # テーマと文字化け修正
  theme(text=element_text(size=30)) + # 文字サイズ
  labs(title="標準正規分布") + # タイトル
  geom_point(aes(q1,0), size=2) + # q1の点
  geom_ribbon(aes(x=x[x<q1], y=y[x<q1], ymin=0, ymax=y[x<q1]), alpha=0.3, fill="blue") + # 灰色区間
  annotate("text",x=-2.1,y=0.02, label="0.025", size=3, col="blue") + # 0.025という文字
  annotate("text",x=-1.4,y=0.01, label="(q1,0)", size=4) # (q1,0)という文字

p2 <- ggplot() +
  geom_line(aes(x,y)) +
  theme_classic(base_family="HiraKakuPro-W3")+ # テーマと文字化け修正
  theme(text=element_text(size=30)) + # 文字サイズ
  labs(title="標準正規分布") + # タイトル
  geom_point(aes(q2,0), size=2) + # q2の点
  geom_ribbon(aes(x=x[x<q2], y=y[x<q2], ymin=0, ymax=y[x<q2]), alpha=0.3, fill="blue") + # 灰色区間
  annotate("text",x=0,y=0.15, label="0.975", size=10, col="blue") + # 0.975という文字
  annotate("text",x=1.4,y=0.01, label="(q2,0)", size=4) # (q2,0)という文字grid.arrange(p1, p2, nrow=1)

grid.arrange(p1, p2, nrow=1)


