【Rで多変量解析#6】クラスター分析(階層型クラスタリング)
記事の目的
クラスター分析(ウォード法)をRを使用して実装していきます。データの作成から実装するので、コピペで再現することが可能です。
目次
1 ライブラリ
library(dplyr)
library(ggplot2)
2 データの作成
set.seed(1)
英語 <- c(rnorm(5, 50, 10), rnorm(5, 70, 10)) %>% round()
数学 <- c(rnorm(5, 50, 10), rnorm(5, 30, 10)) %>% round()
data <- data.frame(英語, 数学)
data %>% head()

3 データの可視化
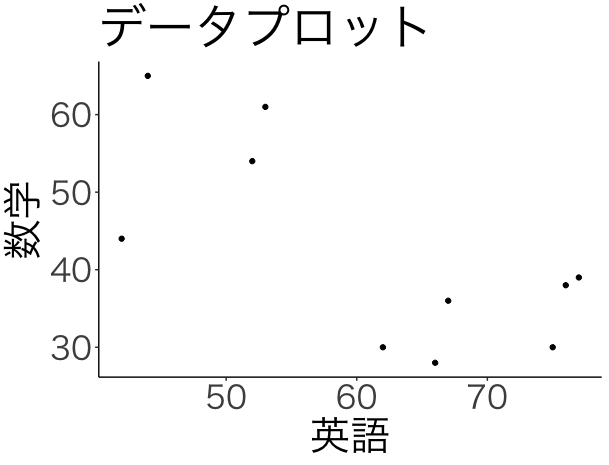
data %>%
  ggplot()+
  geom_point(aes(英語, 数学)) +
  theme_classic(base_family = "HiraKakuPro-W3")+
  theme(text=element_text(size=30))+
  labs(title="データプロット")
4 クラスター分析
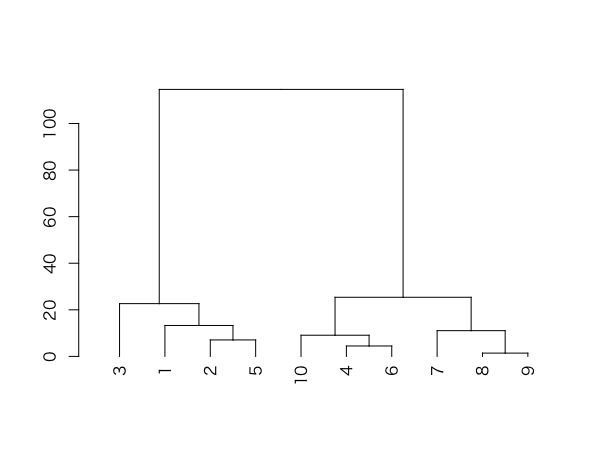
D <- dist(data, method = "euclidean")
cls <- hclust(D, method = "ward.D")
plot(as.dendrogram(cls))
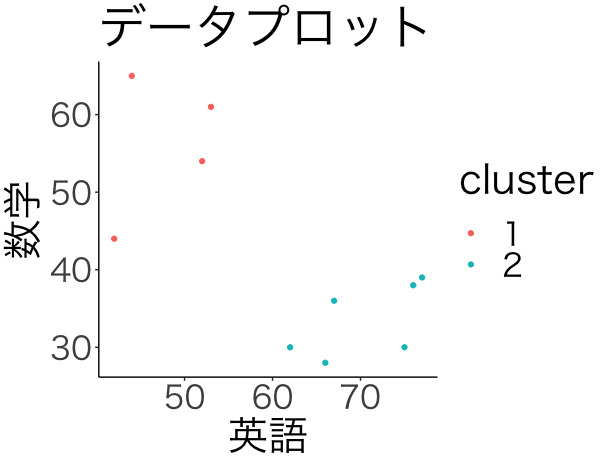
5 結果の可視化
data$cluster <- factor(cutree(cls, k=2))
data %>%
  ggplot()+
  geom_point(aes(英語, 数学, col=cluster)) +
  theme_classic(base_family = "HiraKakuPro-W3")+
  theme(text=element_text(size=30))+
  labs(title="データプロット")