【Rで多変量解析#11】探索的因子分析
記事の目的
主成分分析をRを使用して実装していきます。データの作成から実装するので、コピペで再現することが可能です。
目次
1 ライブラリ
library(dplyr)
library(ggplot2)
library(gridExtra)
library(psych)
2 1因子の場合
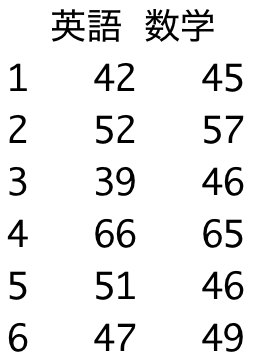
2.1 データ
set.seed(1)
f <- rnorm(100, 50, 10)
英語 <- rnorm(100, f, 3) %>% round()
数学 <- rnorm(100, f, 3) %>% round()
data <- data.frame(英語,数学)
data %>% head()
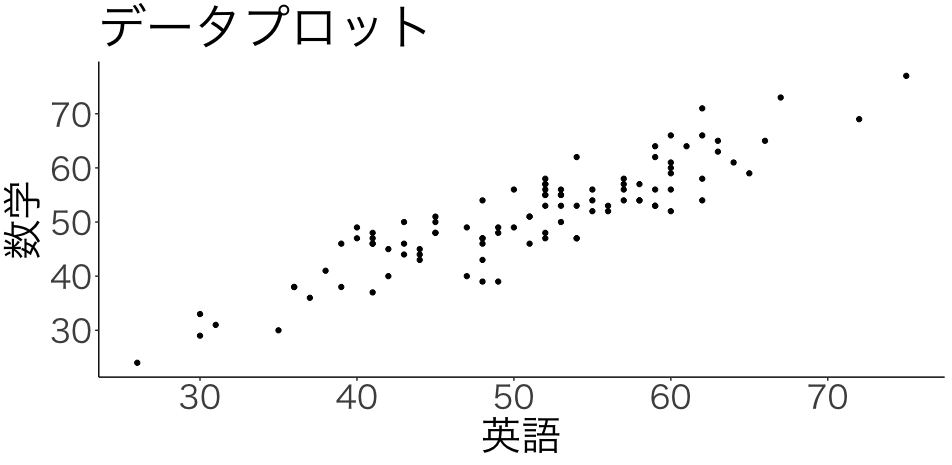
2.2 データの可視化
data %>%
  ggplot() +
  geom_point(aes(英語, 数学))+
  theme_classic(base_family = "HiraKakuPro-W3")+
  theme(text=element_text(size=30)) +
  labs(title="データプロット")
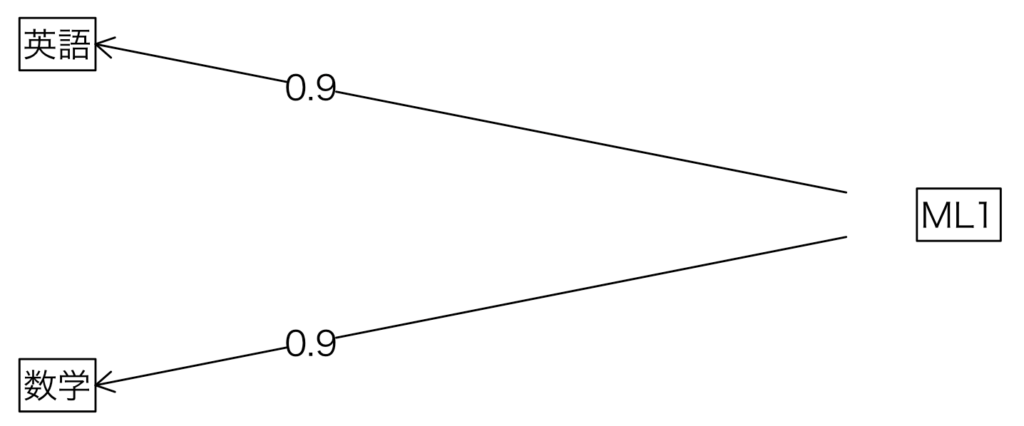
2.3 分析結果
model <- fa(r=data, nfactors=1, fm="ml")
par(family= "HiraKakuProN-W3")
fa.diagram(model)
3 2因子の場合
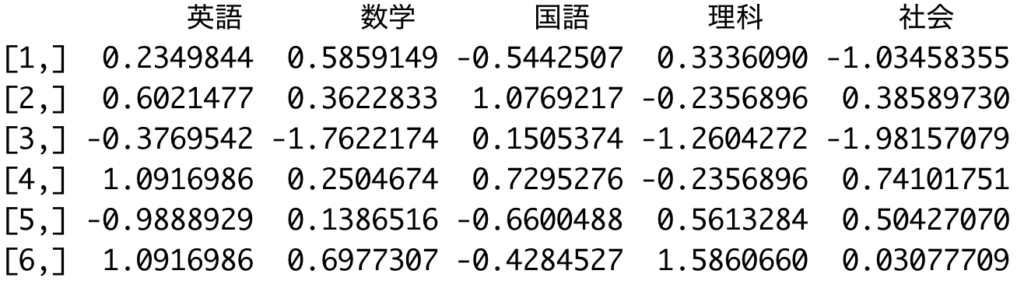
3.1 データ
set.seed(10)
理系 <- rnorm(100, 50, 10)
文系 <- rnorm(100, 50, 10)
英語 <- rnorm(100, 0.7*文系+0.3*理系, 5) %>% round()
数学 <- rnorm(100, 0.3*文系+0.7*理系, 5) %>% round()
国語 <- rnorm(100, 0.7*文系+0.3*理系, 5) %>% round()
理科 <- rnorm(100, 0.3*文系+0.7*理系, 5) %>% round()
社会 <- rnorm(100, 0.7*文系+0.3*理系, 5) %>% round()
data <- data.frame(英語, 数学, 国語, 理科, 社会)
data <- apply(data, 2, scale)
data %>% head()
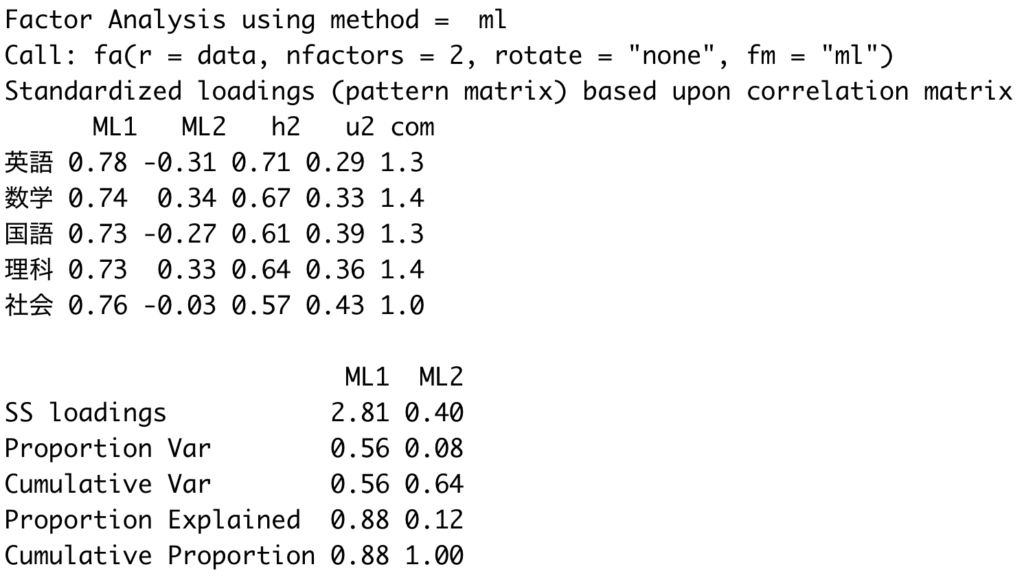
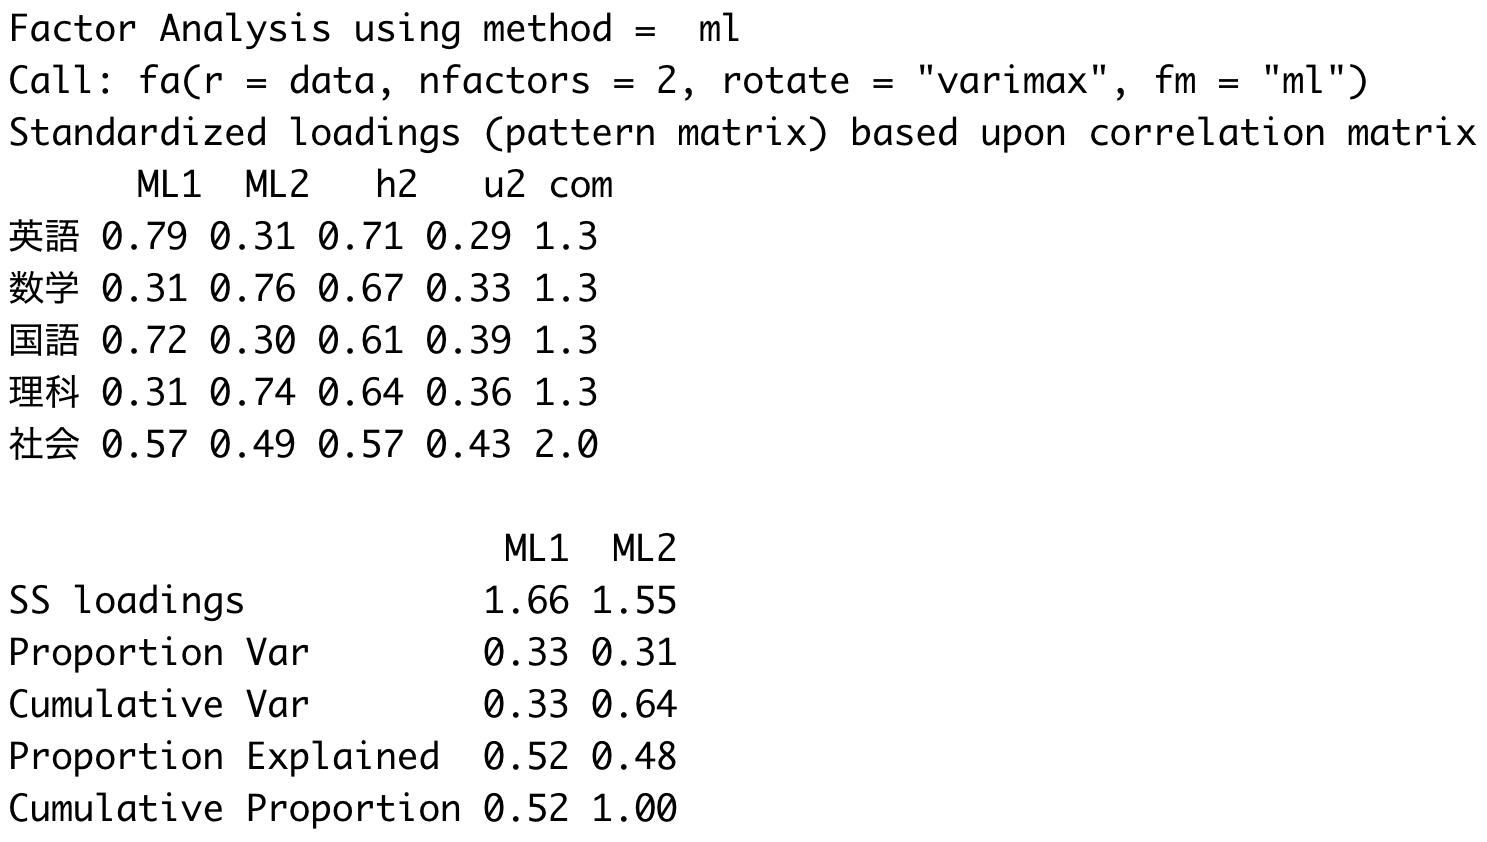
3.2 分析結果
model1 <- fa(data, nfactors = 2, rotate = "none", fm="ml")
model2 <- fa(data, nfactors = 2, rotate = "varimax", fm="ml")
model1 ; model2
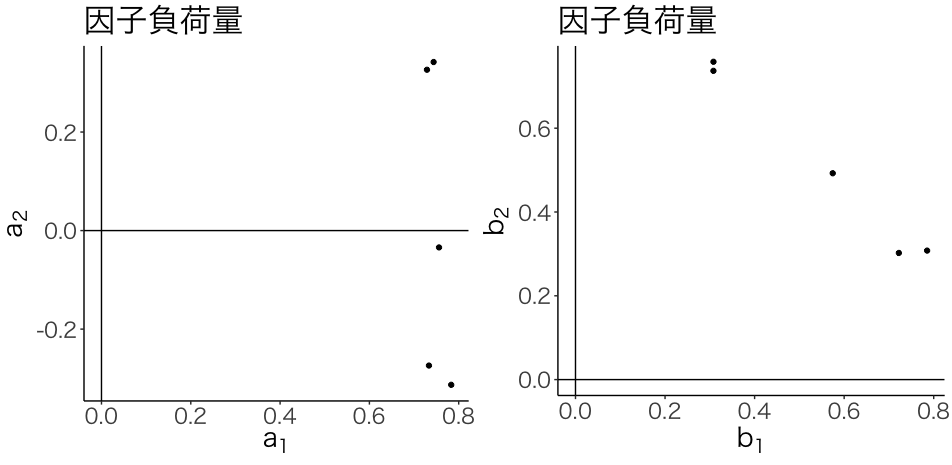
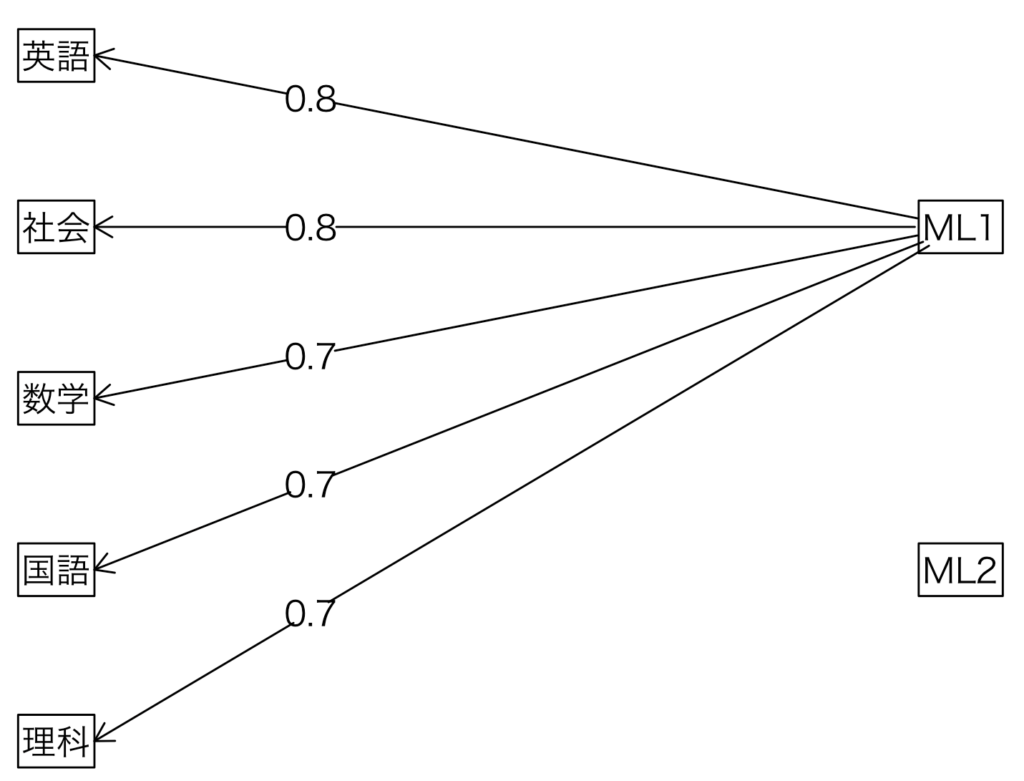
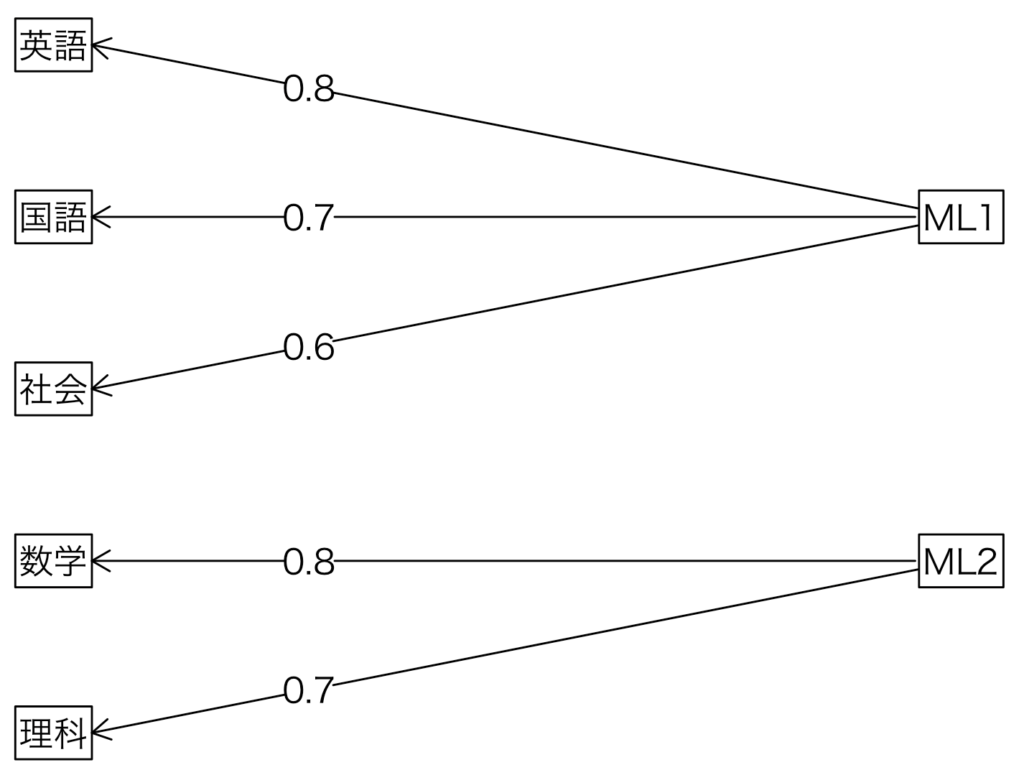
3.3 結果の可視化
fa.diagram(model1)
fa.diagram(model2)
p1 <- ggplot() +
  geom_point(aes(model1$loadings[,1],model1$loadings[,2]))+
  theme_classic(base_family = "HiraKakuPro-W3")+
  theme(text=element_text(size=20)) +
  labs(title="因子負荷量", x=expression(a[1]), y=expression(a[2]))+
  geom_hline(yintercept = 0)+
  geom_vline(xintercept = 0)

p2 <- ggplot() +
  geom_point(aes(model2$loadings[,1],model2$loadings[,2]))+
  theme_classic(base_family = "HiraKakuPro-W3")+
  theme(text=element_text(size=20)) +
  labs(title="因子負荷量", x=expression(b[1]), y=expression(b[2]))+
  geom_hline(yintercept = 0)+
  geom_vline(xintercept = 0)

grid.arrange(p1, p2, nrow=1)