【Rで多変量解析#10】数量化3類
記事の目的
数量化3類をRを使用して実装していきます。データの作成から実装するので、コピペで再現することが可能です。
目次
1 ライブラリ
library(dplyr)
library(ggplot2)
library(MASS)
library(ggrepel)
library(gridExtra)
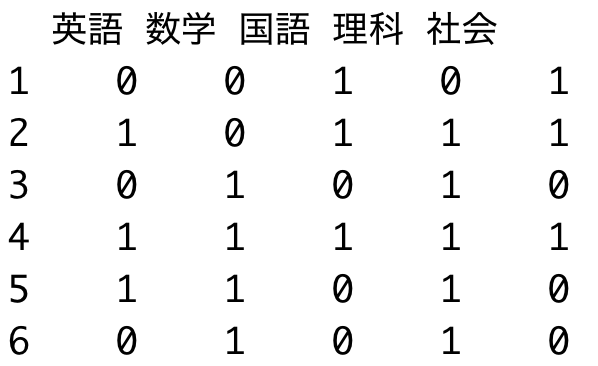
2 データの作成
set.seed(1)
英語 <- rnorm(15, 50, 10) %>% round()
数学 <- rnorm(15, 50, 10) %>% round()
国語 <- rnorm(15, 英語, 5) %>% round()
理科 <- rnorm(15, 数学, 5) %>% round()
社会 <- rnorm(15, 国語, 3) %>% round()
data <- data.frame(英語, 数学, 国語, 理科, 社会) %>%
mutate(英語=ifelse(英語>50, 1, 0)) %>%
mutate(数学=ifelse(数学>50, 1, 0)) %>%
mutate(国語=ifelse(国語>50, 1, 0)) %>%
mutate(理科=ifelse(理科>50, 1, 0)) %>%
mutate(社会=ifelse(社会>50, 1, 0))
data %>% head()
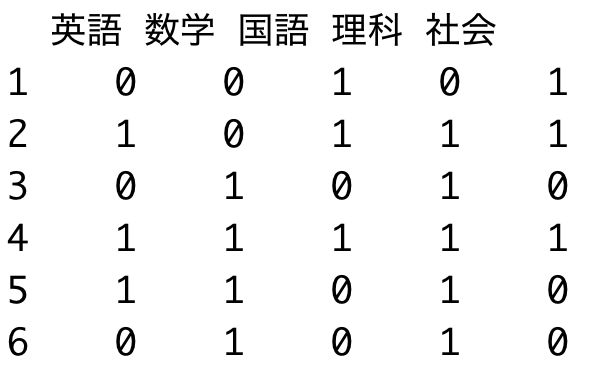
3 データの消去
data <- data[data %>% apply(1,sum) != 0,]
rownames(data) <- 1:nrow(data)
data %>% head()
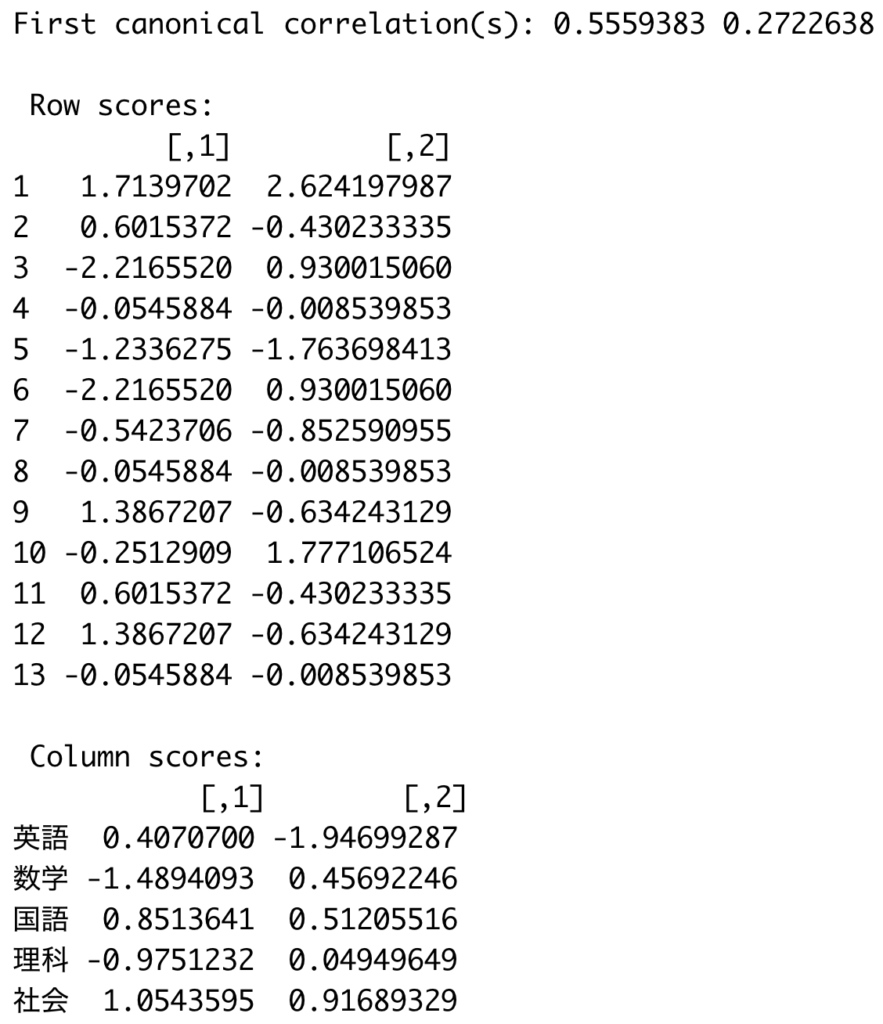
4 数量化3類
model <- corresp(as.matrix(data), nf=2)
model
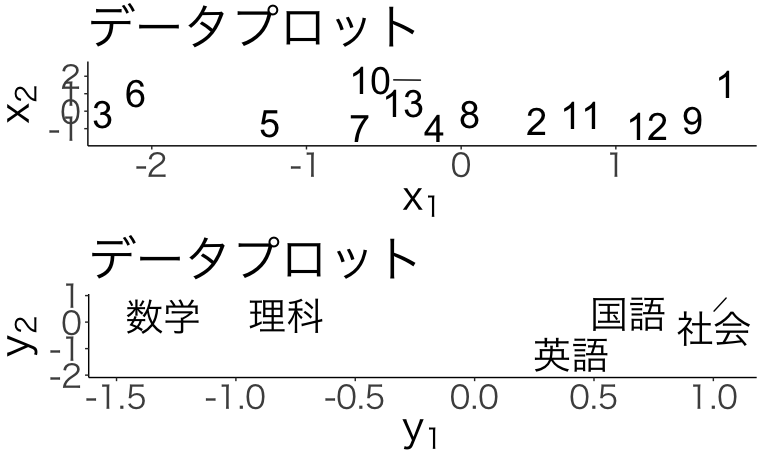
5 結果の可視化
p1 <- ggplot() +
  geom_text_repel(aes(model$rscore[,1],model$rscore[,2],label=1:nrow(data)), size=10) +
  theme_classic(base_family = "HiraKakuPro-W3")+
  theme(text=element_text(size=30)) +
  labs(title="データプロット", x=expression(x[1]), y=expression(x[2]))

p2 <- ggplot() +
  geom_text_repel(aes(model$cscore[,1],model$cscore[,2],label=colnames(data)), size=10, family="HiraKakuPro-W3") +
  theme_classic(base_family = "HiraKakuPro-W3")+
  theme(text=element_text(size=30)) +
  labs(title="データプロット", x=expression(y[1]), y=expression(y[2]))

grid.arrange(p1, p2)