データの特徴や関連性を調べる 【Rで実装】
記事の目的
データの特徴や関連性を確認する方法をRで実装していきます。
- 使用するライブラリ
library(dplyr)
library(ggplot2)
library(GGally) # ggpairs
library(corrplot) # corrplot.mixed()
目次
| 目次 | 概要 |
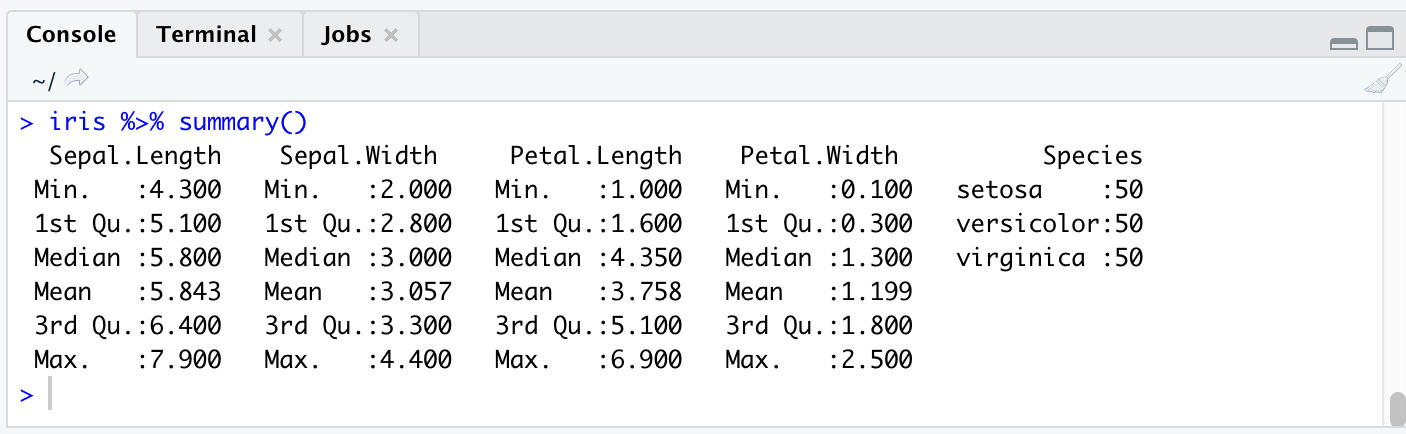
| 1. 統計量の確認 | summary() |
| 2. 2変数の相関関係 | 散布図、相関係数、検定 |
| 3. 多変数の相関関係 | 相関行列、corrplot.mixed()、ggpairs() |
1. 統計量の確認
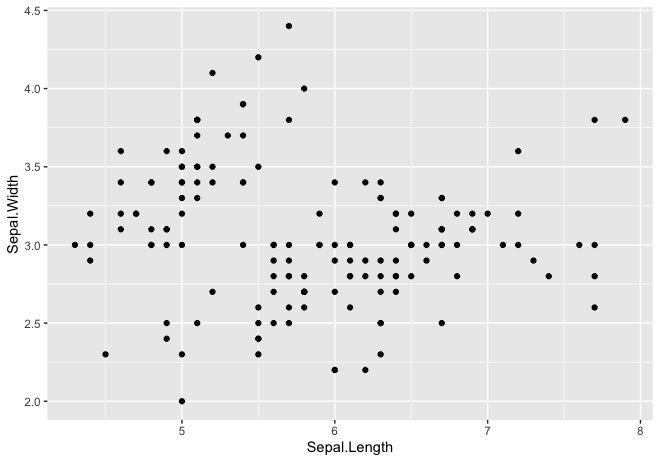
2. 2変数の相関関係
- 散布図
iris %>%
  ggplot(aes(Sepal.Length, Sepal.Width)) +
  geom_point()
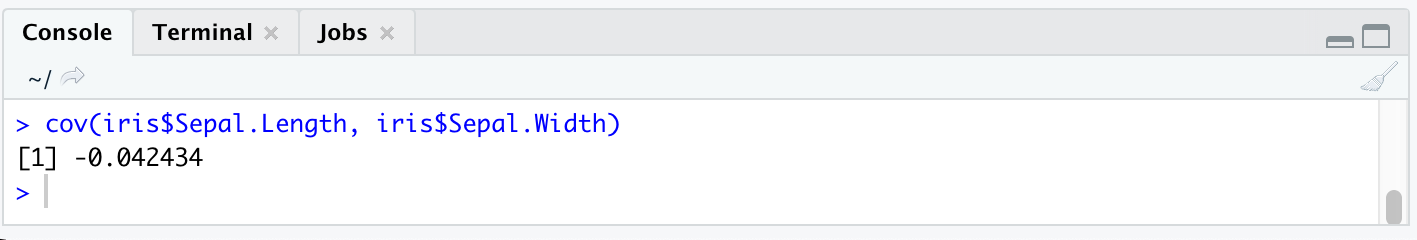
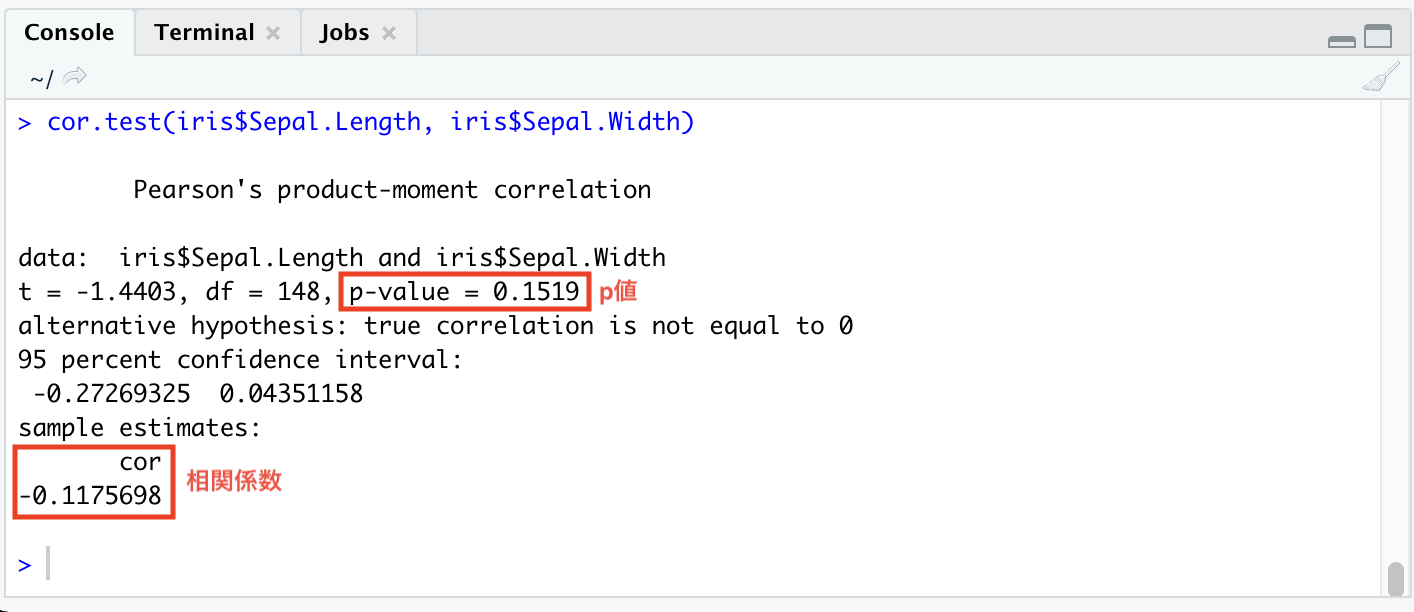
- 相関係数
- 相関係数の検定
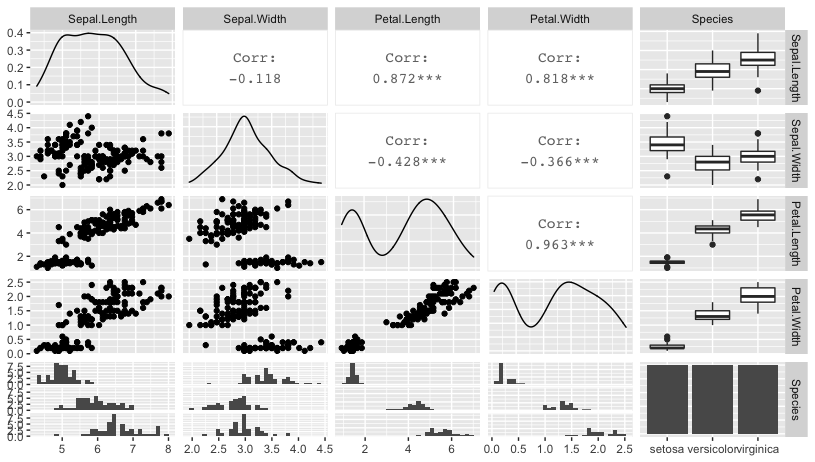
3. 多変数の相関関係
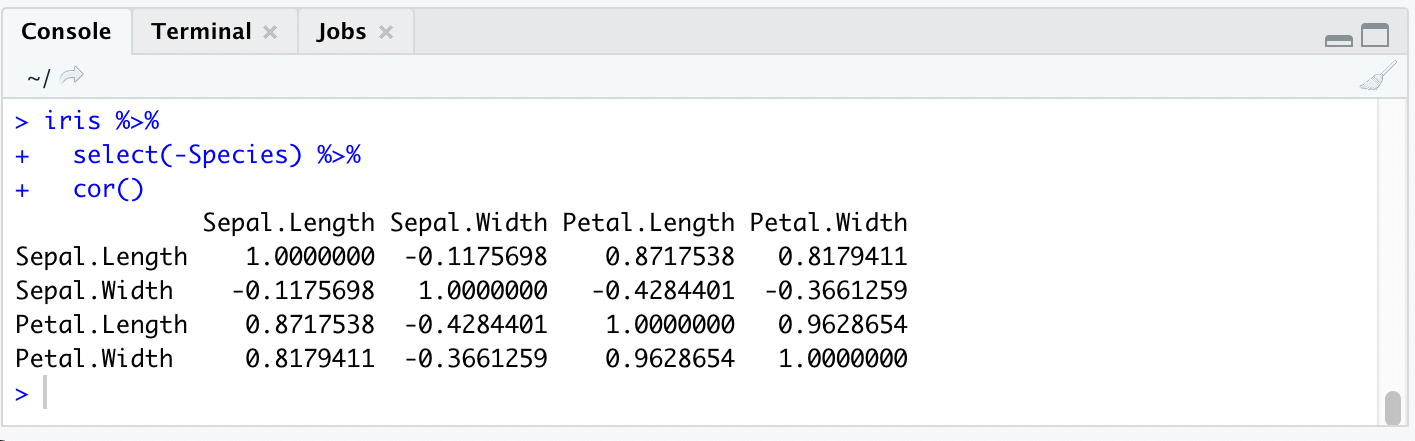
- 相関行列
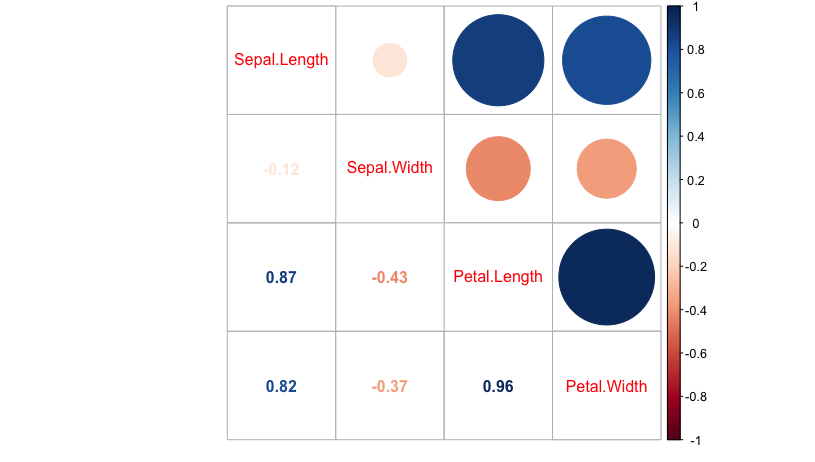
- 相関関係plot1
iris %>%
  select(-Species) %>%
  cor() %>%
  corrplot.mixed()
- 相関関係plot2
iris %>% ggpairs()